African Rainbow Minerals (ARM) is a leading diversified mining company and is listed on the Johannesburg Stock Exchange (JSE). It operates in South Africa, with mines in different provinces, and Malaysia.
Tracking the African Rainbow Minerals share price offers investors insights into commodity cycles, market trends, and long-term growth opportunities.
Here, let’s tackle ARM share price (JSE) analysis, historical trends, analyst predictions, and how the ARM share price (JSE) compares with its competitors.
Company Overview: African Rainbow Minerals (ARM)
In February 1994, Dr. Patrice Motsepe founded Future Mining, a contract mining services company, providing mining services to bigger mining companies.
Then, in 1997, Motsepe founded ARMgold, one of the first Black-owned mining companies in South Africa. ARMgold focused on owning and operating gold mines.
Due to its success, it was listed on the JSE in 2002, allowing investors to own shares of ARMgold. In 2003, ARMgold merged with Harmony Gold and Avmin, which helped create ARM today.
At present, minerals mined by ARM include iron ores, manganese ore, platinum group metals (PGMs), chrome ore, nickel, and coal. Here are the mining divisions under ARM:
ARM Platinum
Under ARM Platinum are ARM’s PGM and chrome assets. PGMs like platinum, rhodium, and palladium are used in car manufacture, jewelry, and other industries.
Here are the mines under these divisions:
- Modikwa Mine – ARM owns 41.5% of this mine, while local communities hold 8.5%.
- Two Rivers Mine – ARM owns 54% of this mine.
- Bokoni Mine – ARM acquired this mine in 2022 and now owns 54% of this mine. Qualified employees, communities, and Black industrialists will also receive 5% share each.
- Nkomati Mine – ARM owns 100% of this mine. However, it is currently under care and maintenance (paused operations).
ARM Ferrous
This ARM division handles iron ore and manganese, which are mainly used in making steel. It is a big earner because of the global steel demand.
Here is a breakdown of the mines under the ARM Ferrous division:
Iron Ore
- Khumani Mine – ARM owns 50%.
- Beeshoek Mine – ARM owns 50%.
Manganese Ore
- Nchwaning Mine – ARM owns 50%.
- Gloria Mine – ARM owns 50%.
Manganese Alloys (Processed Manganese Products)
- Cato Ridge Works – ARM owns 50%.
- Cato Ridge Alloys – ARM owns 25%.
- Sakura – ARM owns 27% of this manganese alloy mine located in Malaysia.
ARM also owns Machadodorp Works, but it is currently being used to develop more cost-effective and energy-efficient ways of smelting.
ARM Coal
Coals are usually traded to Eskom in South Africa for electricity. This mineral is also exported to other countries as a source of energy.
Here are the two main coal businesses of ARM:
- Participative Coal Business Mine – ARM has an effective share of 20.2%.
- Goedgevonden Coal Mine – ARM has an effective share of 26%.
Harmony Gold Mining Company
While ARM does not have a direct hand on the gold market, it owns 11.8% of Harmony Mining Gold Company shares.
This business decision allows ARM exposure to gold prices without directly running a gold mine.
Recent Challenges in Earnings and Revenue
On September 6, 2025, Reuters reported that ARM is shifting its focus to chrome and copper due to weaker PGM and coal prices, which led to a sharp decrease in headline earnings.
On September 5, 2025, ARM suspended mining operations at its Bokoni platinum mine.
The next day, the company approved the construction of a chrome recovery plant at its Bokoni platinum mine, indicating that the platinum ramp-up would be “phased and measured” due to low platinum prices.
ARM Share Price (JSE) Historical Trends
Here is the ARM share price (JSE) analysis graph from September 2024 to the same month this year, according to Investing.com:
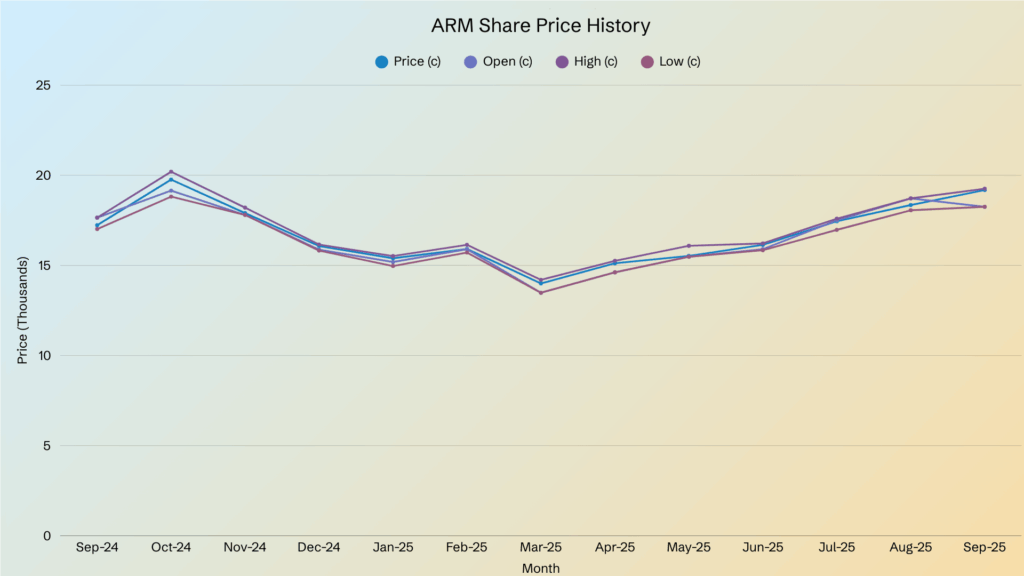
ARM share price (JSE) went from 17,232c in September 2024 to 19,184c in September 2025. This trend showed that the ARM share price (JSE) had an 11.3% increase year-on-year.
However, there were big dips in ARM share price (JSE) during late 2024 and early 2025 and recoveries in mid-to-late 2025.
Downward Phase (September 2024 to March 2025)
During this period, the ARM share price (JSE) fell from 17,232c to 14,000c, noting an 18.7% decrease. The lowest ARM share price (JSE) in this period was observed in March 2025 at 14,000c.
The biggest monthly dips in ARM share price (JSE) were observed in February and March 2025, with a fall of -1.69% and 3.70%, respectively.
This downward trend in ARM share price (JSE) may be due to the weak commodity prices, reduced demand, and company-specific headwinds.
Recovery Phase (April to September 2025)
A strong rebound in ARM share price (JSE) was noted from April 2025 (15,119c) to September 2025 (19,184c), accounting for a 26.9% gain.
The best recovery months for the ARM share price (JSE) were April and September 2025, with changes of 3.63% and 5.53%, respectively.
Overall, the ARI share price [JSE] analysis showed short-term weakness and long-term strength, as shown by the ARM shares correcting sharply in early 2025 and rebounding strongly by September 2025.
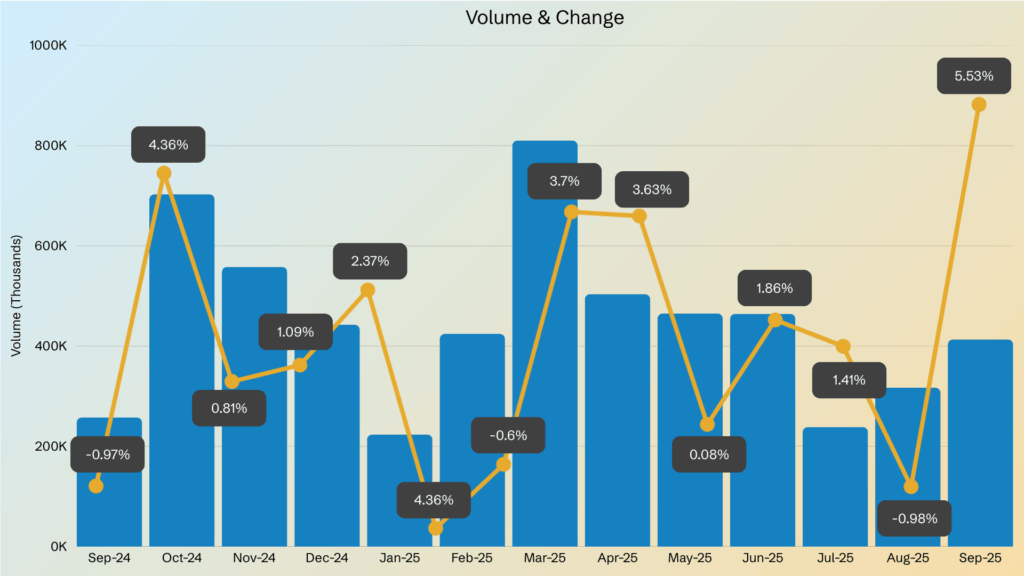
The highest trading volume was observed in March 2025 at 810.12K, which aligns with the price bottom. This data suggests panic selling and accumulation.
Meanwhile, the lowest trading volume was observed in July 2025 at 238.38K, which showed that there is less market activity during the gradual recovery.
The high volume during downturn periods, especially in March 2025, suggests huge institutional repositioning.
Moreover, despite its volatility, JSE:ARI had a double-digit annual growth of 11.3%.
Recent Market Trends for ARM Share Price (JSE)
Here are some key figures for JSE:ARI as of September 22, 2025, according to Investing.com:
| Metric | Value |
| Share price | 17,328c |
| 52-week high/low | High: ~20,349c Low: ~176c |
| Market capitalization | ZAR 34.11 billion |
| P/E ratio | 102.6× |
| Earnings per share | 169c |
| Dividend yield (%) | 6.1 |
According to ARM’s annual results for F2025 (ended in June 2025), the headline earnings decreased by 47% from ~ZAR 5.08 billion or 2,591c per share in F2024 to ~ZAR 2.70 billion or 1,379c per share.
This decline reflects weaker US$ iron ore prices and increased mechanized development costs at Bokoni.
Analyst Predictions for JSE:ARI
Here is a breakdown of analysts’ forecasts for JSE:ARI in the next 3 years:
| F2025 | F2026 | F2027 | F2028 | |
| Revenue (ZARb) | 11.66 | 14.22 | 15.89 | 14.69 |
| Earnings (ZARb) | 0.33 | 3.37 | 3.84 | 4.87 |
| EPS (c) | 168.8 | 1,741.0 | 1,925.1 | 2,518.2 |
| EPS range (c) | 1,464.3 – 2,083.7 | 1,655.4 – 1,826.5 | 1,487.8 – 2,231.6 | 2,063.0 – 2,973.4 |
Analysts estimated that ARM’s revenue will grow 15% p.a. on average in the next 2 years, in contrast to their 7.2% growth forecast for the metals and mining industry in South Africa.
They forecast an earnings growth rate of 47.9% per year, and it is expected to grow faster than the South African market. An earnings per share (EPS) growth rate of 49.22% per year was also forecasted.
However, these values have been updated a few times, reflecting a downward trend.
This trend may indicate that the analysts used to expect more revenue and EPS but are now expecting less, which is common in business.
Analysts estimated that revenue and earnings would reach ~ZAR 14.22 billion and ~ZAR 3.37 billion per year by June 30, 2026.
They also forecasted that the revenue and earnings would reach ~ZAR 15.89 billion and ~ZAR 3.84 billion per year by June 30, 2027, respectively.
However, analysts expect a downward trend in revenue and earnings in 2028, ~ZAR 14.69 billion and ~ZAR 4.87 billion per year, respectively.
ARM Share Price (JSE) vs. Competitors
The table below shows how the ARM share price (JSE) compares to its competitors as of September 22, 2025, based on key metrics (data from Investing.com):
| Name | Ticker | Price (c) | Market Cap (ZARb) | EPS (c) | P/E Ratio | Dividend Yield (%) | EV/EBIDTA |
| African Rainbow Minerals Ltd | JSE:ARI | 17,245 | 33.5 | 169 | 101.6x | 6.1 | 75.0x |
| DRDGOLD | JSE:DRD | 4,591 | 38.3 | 2601 | 17.4x | 1.6 | 11.0x |
| Pan African | JSE:PAN | 2,041 | 41.8 | 127 | 16.6x | 1.9 | 10.6x |
| Northam Platinum Holdings Ltd | JSE:NPH | 24,398 | 89.8 | 402 | 56.5x | 0.9 | 18.8x |
| Kumba Iron Ore Ltd | JSE:KIO | 32,673 | 104.9 | 4571 | 7.2x | 11.2 | 3.9x |
| Sibanye Stillwater Ltd | JSE:SSW | 4,199 | 118.9 | -126 | −33.3x | 3.73 | 7.4x |
| Harmony Gold Mining Company Ltd | JSE:HAR | 30,204 | 187.9 | 2313 | 13.2x | 1.4 | 6.2x |
| Impala Platinum Holdings Ltd | JSE:IMP | 19,400 | 174.4 | 85 | 229.7x | 0.88 | 16.3x |
| Valterra Platinum Ltd | JSE:VAL | 105,490 | 276.6 | 503 | 210.2x | 0.5 | 17.0x |
| Gold Fields Ltd | JSE:GFI | 72,393 | 647.8 | 3724 | 20.0x | 2.0 | 10.4x |
In terms of the share price, Valterra and Gold Fields were the highest at 105,490c and 72,393c per share, respectively.
DRDGOLD and Pan African had the lowest share prices at 4,591c and 2,041c per share, respectively. ARM share price (JSE) is mid-range, sitting at 17,245c per share.
Kumba, Harmony, and Gold Fields had the highest EPS at 4,571c, 2,313c, and 3,724c, respectively. Meanwhile, DRDGOLD, Northam, and Valterra had mid-range EPS at 2,601c, 402c, and 503c, respectively.
ARM ranks near the bottom in terms of EPS, with 169c, along with Impala and Sibanye at 85c and -126c, respectively.
In terms of dividend yield, ARM had ranked second for dividend yield at 6.1%, second only to Kumba at 11.2% and followed by Sibanye at 3.73%.
Meanwhile, Gold Fields and DRDGOLD had moderate dividend yields at 2.0% and 1.6%, respectively. Lastly, Impala and Valterra had the lowest dividend yield at 0.88% and 0.5%, respectively.
In terms of the EV/EBIDTA, Kumba, Harmony, and Sibanye were the cheapest relative to cash flow value at 3.9x, 6.2x, and 7.4x, respectively.
DRDGOLD, Pan African, and Gold Fields were in the mid-range at 11.0x, 10.6x, and 10.4x, respectively. Lastly, ARM was the most expensive relative to cash flow at 75.0x, followed by Northam (18.8x) and Impala (16.x).
You may also be asking…
Who owns African Rainbow Minerals?
The Motsepe family owns the majority of ARM, accounting for 40.51% of shares.
Public Investment Corporation (SOC) Ltd. owns ~8.35%, BBEE Trust – Broad-Based Economic Empowerment Trust owns ~7.08%, and Allan Gray (Pty) Ltd. holds ~5.18% shares.
ARM also holds ~5.66% of its own shares, and private and public shareholders hold the remaining shares.
Is African Rainbow Minerals listed on the JSE?
Yes, it is listed in JSE with the ticker “ARI.”
Where is African Rainbow Minerals located?
ARM is headquartered in Sandton, South Africa, and has mining operations across South Africa.
Key Takeaway
ARM stands out as one of South Africa’s most diversified mining companies, with strong exposure to PGMs, iron ore, manganese, and coal, as well as a strategic stake in gold through Harmony Gold.
While the ARM share price (JSE) has faced volatility due to weaker commodity prices and operational challenges, the group’s consistent dividend policy and diversified portfolio provide investors with stability.
Looking forward, analysts expect gradual revenue and earnings growth for ARM through 2027, supported by long-term demand for metals and energy.
However, future performance will depend on global commodity cycles, local market conditions, and cost management.
If you want to keep informed about the fluctuating ARM share price (JSE), CommuniTrade is a space where verified traders share information about trading topics. Get access to insightful tips, financial mentor advice, and more exclusive perks that await.

