Have you ever noticed a hammer-shaped candle in a Japanese candlestick chart? Pay attention to it because it reveals important information about potential market direction.
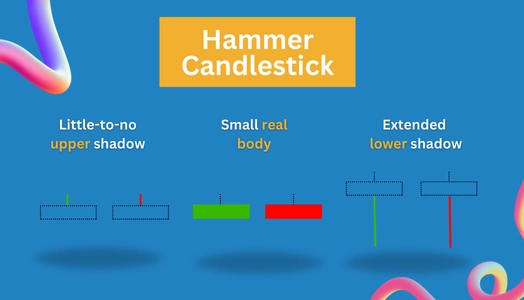
A hammer candlestick resembles a literal hammer. It has a small real body (the head) and a long lower shadow (the handle) that extends significantly longer than the rest of the candle. This pattern indicates that the asset was trading much lower during the period but rallied up and closed near its opening price.
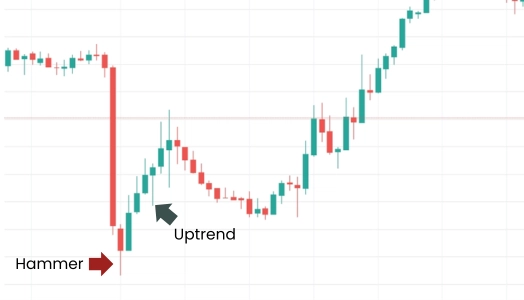
When this candle forms, it signals a bullish reversal pattern. This market trend occurs from the emerging buying pressure from the bull and the exhaustion of selling pressure from the bears.
In this Japanese candlestick guide, you’ll explore the concept of a hammer candlestick, specifically how it forms and differs from other candlestick patterns like an inverted hammer, hanging man, shooting star, and Doji candlesticks.
What Is a Hammer Candlestick?

A price chart with a hammer pattern indicates a potential bullish market reversal. This candle often forms in a declining market or when the market is about to find its bottom after a series of red candles.
The question is, what should you do after spotting a bullish hammer candlestick? Wait for a confirmation candle and trade it according to your open position.
- Wait for a confirmation candle. It should be a bullish (green) candlestick that occurred right after the red hammer.
- Enter a long position with a stop-loss order below the real body or its lower shadow.
- Once confirmed, exit an open short position to secure your earnings. Alternatively, modify your limit order if you still need to finalize the signal.
However, remember that you should never use a hammer pattern in isolation. Like any chart pattern, you must use a hammer candle with price or trend analysis or other technical indicators to confirm the bullish reversal signal.
How Does a Hammer Candlestick Form?

The hammer candlestick can be a bullish (green) or a bearish (red) candle. Its distinguishable characteristic is it looks like a hammer or “T”—a small real body, a long lower shadow, and an almost nonexistent upper shadow.
The candlestick pattern forms due to the emerging bulls‘ buying pressure and the exhausting bears’ selling pressure.
During this market period, the asset trades significantly lower, seemingly determining its bottom and carrying its declining momentum. Due to the buying pressure brought by the bulls, the asset rallies and closes near its opening price.
Remember, a hammer candlestick is not valid until a confirmation candle occurs, which is a bullish (green) candle. Placing a trade solely on a single hammer candle, or just any indicator, is detrimental because it’s prone to providing false signals.
The confirmation candle must form right after the hammer. This confirmation candle represents the current buying pressure in the market and signals a potential bullish trend.
Hammer vs. Hanging Man
The hammer and hanging man are hammer candlestick patterns with the same characteristics. Both these candles have an extended lower shadow and a small real body.
But how do you know which is which? Well, you must look at the trend in which the candle occurred.
| Candlestick Type | Preceding Trend | Signal |
|---|---|---|
| Hammer Candlestick | Market downtrend | Bullish Reversal Pattern |
| Hanging Man Candlestick | Market uptrend | Bearish Reversal Pattern |
The hammer candlestick pattern forms at the bottom of the support zone, while the hanging man occurs appears at the resistance zone.
How to Recognize a Hanging Man
A hanging man candle only appears when an uptrend precedes the asset. If you spot one when the market is red, it’s not a hanging man but a hammer candle.
A hanging man candle forms when the market highs experience extreme selling pressure from the bears.
In an uptrend market, higher highs and lower lows are formed when the buyers (bulls) are in charge. However, the formation of a hanging man indicates that the selling pressure from the bears is pushing the market to trade significantly lower.
Shooting Star vs. Inverted Hammer
When discussing Japanese candlestick patterns, the shooting star and inverted hammer are the opposite of the hanging man and hammer candle.
Both shooting star and inverted hammer candles look the same. These two candles have long upper shadows, almost or no lower shadows, and small real bodies.
But how does a shooting star differ from the inverted hammer? Well, you can spot which is which by looking at the trend in which the candle is formed.
How to Recognize Shooting Star

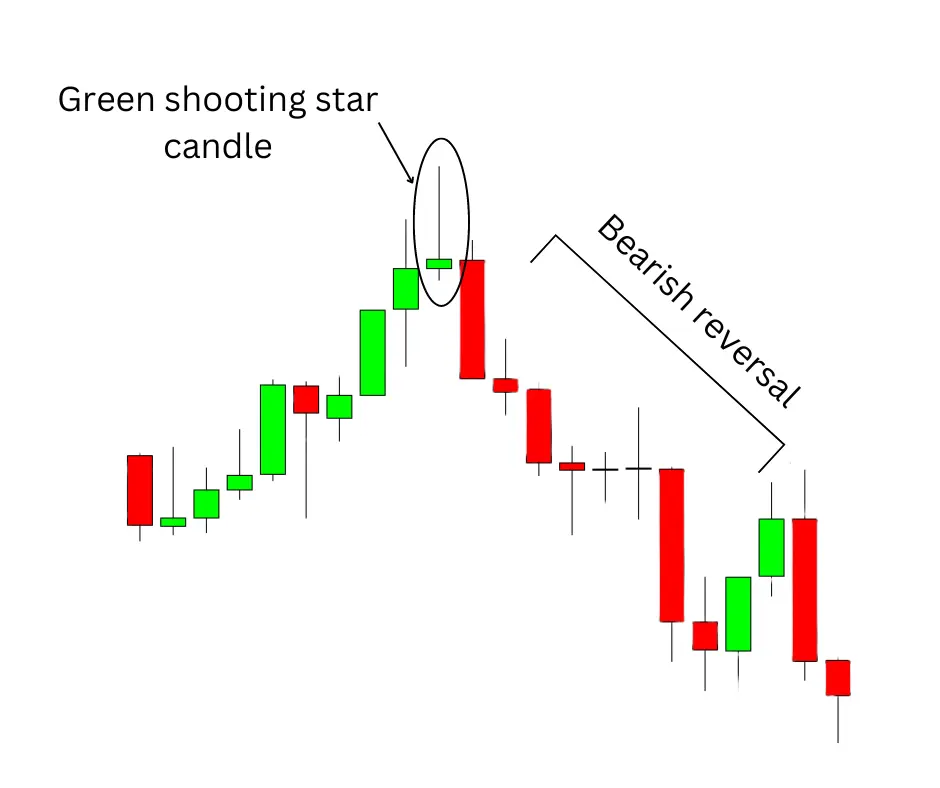
The shooting star pattern shows at the peak of an uptrend. It signals a potential reversal from its prevailing uptrend.
As mentioned, a shooting star candle has a long upper shadow and a small real body.
- A long upper shadow forms the moment the asset trades significantly higher, mainly driven by the carried-off uptrend momentum.
- The small real body represents the failed efforts of buyers to push the price further up and the intervention of sellers that makes the asset close near its opening price.
How to Recognize Inverted Hammer
Unlike the shooting star candle, an inverted hammer is a bullish reversal pattern as it forms at the bottom of a downtrend.
An inverted hammer shares the same features of a shooting star pattern—a long upper shadow and a small real body. The difference is that the inverted hammer is a bearish (red), and the shooting star is a bullish (green) candlestick.
An inverted hammer indicates that the bulls are taking over the market, making the asset trade significantly higher than its opening price.
Hammer vs. Doji: The Differences
Doji is another candlestick pattern that signals a potential market movement. However, it is completely different from the four candles discussed above.
Let’s review first:
- Both hammer and inverted hammer patterns suggest an upside reversal, suggesting that the asset will trade upward after the market decline.
- Both shooting star and hanging man indicate that the market will potentially decline after its prevailing uptrend.
While these four candles suggest market reversals, the Doji pattern indicates consolidation, continuation, or market indecision.
While a doji candle has a small real body, it features upper and lower shadows. These shadows on each end represent the market indecision or consolidation.
This characteristic makes it distinct from the hammer candlestick. Remember, a hammer candle usually doesn’t feature an upper shadow.
Hammer vs. Inverted Hammer Pattern
The hammer and inverted hammer candlestick patterns signal a potential bullish reversal trend. Both these candles form at the bottom of a declining market, signaling that the market will reverse in trend.
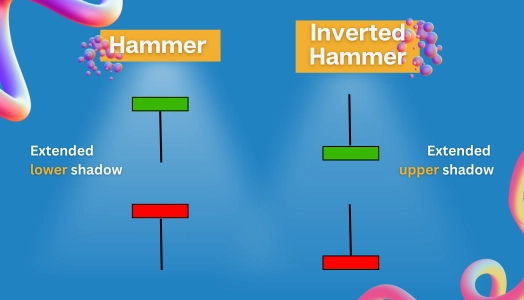
The only difference between the two is the extension of the candle shadow, which is solely driven by the bullish or bearish bias.

A hammer candlestick has a shadow that extends lower because of the selling pressure experienced by the market.
An inverted hammer pattern features a shadow that extends higher, indicating that the market trades significantly higher than its opening and closing prices.
| Hammer Candlestick | Inverted Hammer Candlestick |
|---|---|
| Has an extended lower shadow | Has an extended upper shadow |
| Called as a hanging man candle once appeared at the peak of a green market | Referred to as a shooting star candle when it formed at the peak of a market with a bullish pattern. |
Advantages of Hammer Candlestick
Easy to Spot
A hammer candlestick pattern occurs at the bottom of a declining market and has a distinctive shape that makes it easy to spot amidst other candlesticks.
This simplicity allows even beginner traders to spot potential market reversals quickly. Remember, look for a hammer-shaped candle—long lower shadow, a small ready, and an almost nonexistent upper body.
Bullish Reversal Indicator
A hammer candlestick pattern is a reliable indicator of bullish reversal. The moment this pattern appears, it suggests that the market is beginning to shift from a bearish trend to a bullish one.
The long lower shadow represents the effort of the sellers to push the price down, while a small real body signifies the buyer’s taking control to drive the price back up. This combination of candlestick features indicates the strong buying pressure brought about by the bulls, which can potentially drive a bullish trend.
Applicable for Different Time Frames
The hammer candlestick pattern can be used across various time frames, making it versatile for different trading strategies. Whether you are a day trader looking at minute-by-minute charts or a long-term investor analyzing weekly trends, the hammer pattern can provide valuable insights into market movements.
Limitations of Hammer Candlestick
While the hammer candlestick pattern has its advantages, it also has limitations. It’s crucial to be aware of these to use the pattern effectively in trading decisions.
False Signals
The main criticism of a hammer candlestick is its tendency to provide a false signal. Remember, not every hammer results in a bullish reversal.
Without proper confirmation from additional technical indicators or price action, premature or incorrect trades can occur and might damage your investment.
Requires Confirmation
For the hammer candlestick pattern to be a reliable indicator, it must be confirmed by a subsequent bullish candle. Traders should look for a bullish candle forming after the hammer to confirm the upside reversal.
Without this confirmation, this price formation alone is not a sufficient basis for making trading decisions.
Limited Predictive Power
While useful, a hammer candlestick pattern offers limited predictive power. It does indicate potential reversal but doesn’t provide information on the strength and duration of the new trend.
You should use a hammer pattern in conjunction with other analysis tools to come up with a more accurate and informed trading decision.
Frequently Asked Questions
Is Hammer Candlestick Pattern Bullish?
Yes, the hammer candlestick pattern is generally considered a bullish reversal pattern. It typically forms after a downtrend and suggests that the price may start moving upwards.
What Other Indicators Signal Bullish Reversal Pattern?
Aside from the hammer candlestick pattern, here are the other indicators that signal a bullish reversal trend.
- Bullish Engulfing Pattern
- Morning Star Pattern
- Piercing Line Pattern
- Bullish Divergence in RSI (Relative Strength Index)
- MACD (Moving Average Convergence Divergence) Bullish Crossover
- Double Bottom Pattern
- Inverted Head and Shoulders Patterns
- Doji Candlestick Patterns
The Bottom Line
Your ability to spot a bullish reversal trend using a hammer candlestick is an essential skill for being profitable in online trading. A hammer candle can be a powerful technical indicator, especially when used in conjunction with other price or trend analyses.
Want to learn more effective and proven technical indicators for spotting potential market trends? Join our community of traders in CommuniTrade!
TRU CommuniTrade is a safe and verified trading space where you can interact with other traders, share trading questions, learn from members’ first-hand experiences, and get ultimate support from the community broker reviews, trading signals, and market insights.


