Japanese candlestick analysis is arguably the most popular method for trading price actions. With a Japanese candlestick, you have an easy-to-understand yet comprehensive visual presentation of the market price movement.
A shooting star candlestick is among the popular indicators to identify a bearish reversal pattern. The moment an uptrend is nearing its end, and its momentum is about to exhaust, the market tends to form a shooting star pattern—a bearish candle with a long upper shadow and almost the same open, low, and closing prices.
In this Japanese candlestick guide, you’ll understand the general concept of the shooting star candlestick, specifically, how it forms and how to identify it. Ultimately, you’ll learn how to read and trade the shooting star pattern in your candlestick chart.
Understanding Shooting Star Candlestick
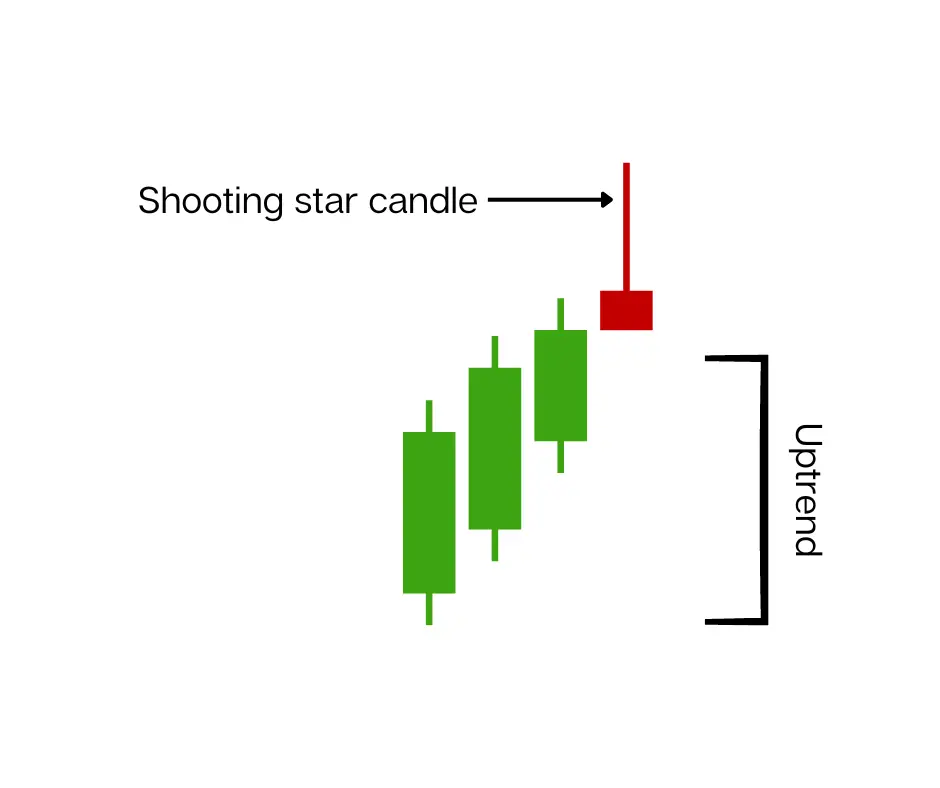
In Japanese candlestick analysis, shooting star candlestick patterns represent a bearish reversal trend. This market trend forms a set of bearish candles that resemble the look of falling shooting stars. These candles have long upper shadows (the tail) and very small real bodies (the shooting star’s body or the asteroid-based rock).
The moment the market formed this shooting star pattern, it signaled a bearish reversal. If you’re familiar with the hammer candle, this is the polar opposite of it.
For your reference, here’s how the two differ from one another.
| Hammer Candlestick | Shooting Star Candlestick |
|---|---|
| The wick extends lower | The wick extends higher |
| Almost the same opening, higher, and close prices | Almost the same opening, lower, and close prices |
The general rule for both candle patterns is that the wick (also known as ‘Shadow’) should be at least twice as long as the real body. Moreover, the longer the wick extension is (high for a shooting star, low for a hammer), the stronger the reversal signal is.
That is because a long wick represents the inability of the market to continue its prevailing trend.
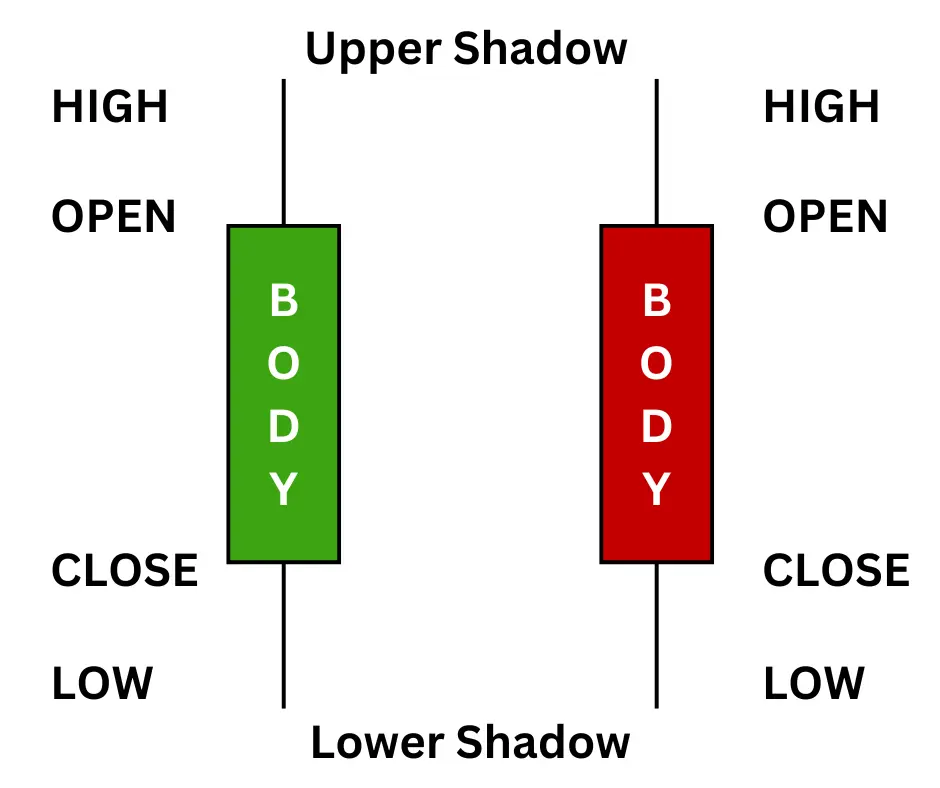
The occurrence of shooting star indicates that the buyers are losing control on the market. During this market event, buyers try to push the price up, enter sellers; subsequently driving the price back down.
On the other hand, the hammer candle represents the opposite—it’s the sellers who lose control over the market trend due to the participation of buyers.
How Is the Shooting Star Pattern Formed?
As mentioned, the shooting star candlestick pattern forms when the uptrend is nearing its end and about to exhaust its upward momentum.
Shooting star candles have long upper shadows (wick), little to no lower shadows, and a relatively small shooting star’s body.
A shooting star occurs in the candlestick chart when the seller enters the bullish (green) market, pushing the price down.
The long upper shadow is formed by the buyers’ efforts to push the price further. However, it failed to become a candle’s closing price as the seller prevailed and pushed the price down near its opening price, which created a small real body. This pattern suggests that buyers are losing momentum, and the selling pressure the market experiences is dragging it down, resulting in the formation of a bearish candlestick pattern.
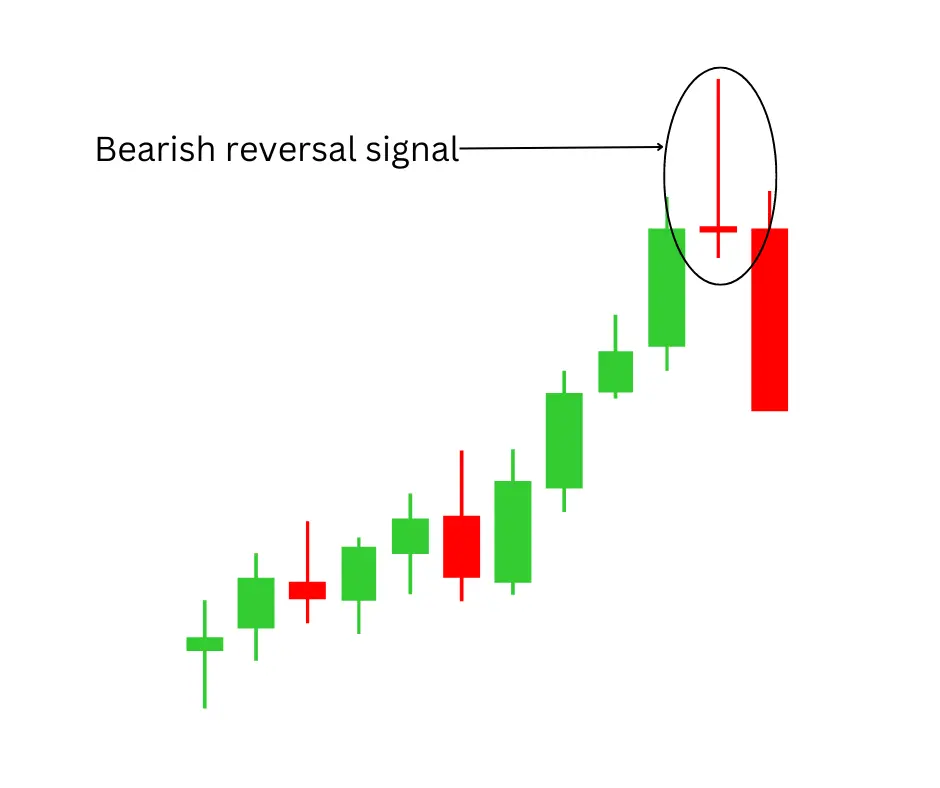
Still confused with the formation of a shooting star candlestick pattern?
Say you’re monitoring the gold (XAU) market, and currently, it’s trending upward—the prevailing trend since yesterday’s market. As per monitoring, the market has an opening price of USD 2305.785, and currently, it’s trading at 2307.500. However, the market failed to trade above 2307.500, which makes it the intraday high.
However, sellers enter and begin exerting pressure, which pushes the price down toward its opening price. By the end of the trading session, the price settles back near the opening price, closing at a level close to USD 2305.785.
This forms a candle with a long upper shadow (representing the uptrend it trades) and a small real body on the trading chart, which are the hallmarks of shooting star patterns.
Let’s say you’ve spotted a market forming a shooting star candlestick pattern. Should you trade it right away?
Well, beginner and unprofitable traders might and probably would. But if you’re serious about profiting from your position, you should wait for the confirmation candle before acting upon the forming shooting star candlestick pattern.
Shooting Star Pattern Confirmation
The golden rule when identifying a shooting star pattern is to never trade it with just a single candle. You should wait for the next period, represented by a candle, to see how the market trends. This is what we call a confirmation candle.
Now, does the price decline after the first shooting star candle? Then, it may indicate a clear sell signal. However, if the price goes back up, the candle is just a mere false signal.
Remember, false signals are quite common when trading market patterns and acting on them prematurely can lead to losses.
That’s why confirming the pattern formation is crucial before making any decisions. Using technical indicators, waiting for confirmation points, and aligning your analysis with broader market conditions are essential steps to improve your trade accuracy.
But don’t stop there—why navigate the market alone when you can leverage the power of a community? At CommuniTrade you can ask questions, exchange strategies, and learn from others who have faced similar challenges.
Engaging with fellow traders gives you access to real-time insights, signal confirmations, and a deeper understanding of market trends. By maximizing the power of collective knowledge, you can avoid false signals, sharpen your strategies, and make more informed decisions.
How to Read Shooting Star Candlestick?
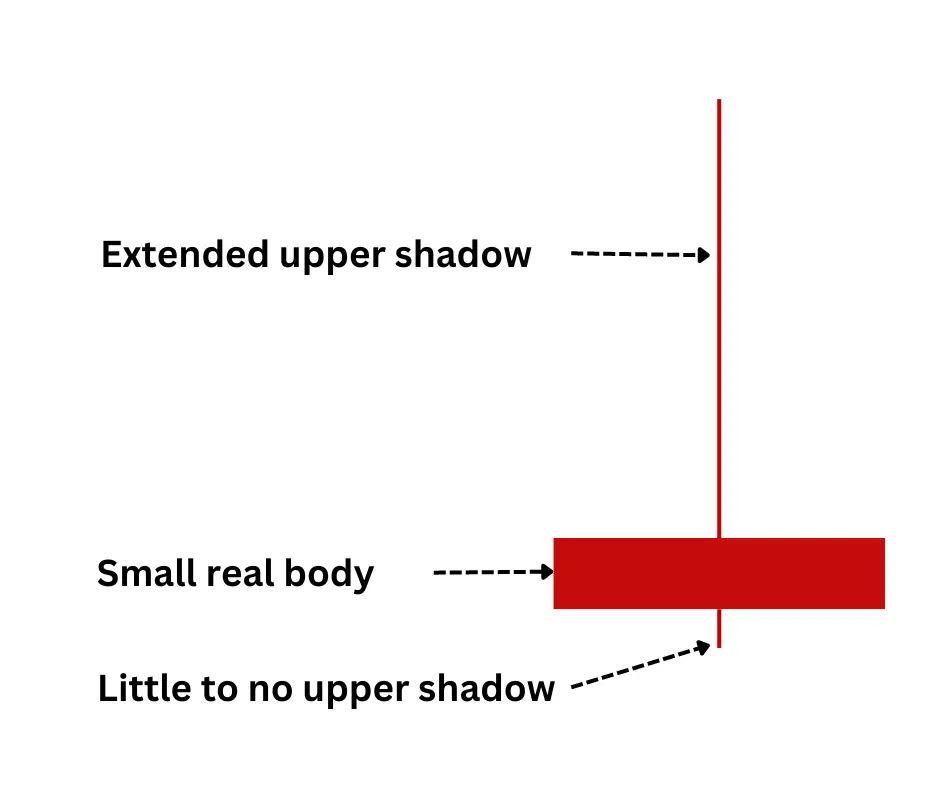
When a shooting star pattern appears on your candlestick chart, it may indicate a strong sell signal. This presents opportunities for the bears and risks for the bulls.
But what would happen if you missed a shooting star candlestick? Well, you either lose profits or let slip potential profits.
Here are the key factors: You must be constantly alert if you want to trade the shooting star on the candlestick chart.
Long Upper Shadow
When a shooting star candlestick appears, the market experiences a high selling pressure amidst its price appreciation.
Due to this market situation, the candle will surely have an extended upper shadow. This candle represents that the market has peaked at a significantly higher price point but couldn’t hold onto that position.
Small Read Body
Another hallmark of a shooting star candlestick is its small real body, representing almost the same or close opening and closing prices.
Assume the EUR/USD market starts its intraday at 1.2000 and reaches its intraday high at 1.2500. But then pressure from sellers emerges in the market. Consequently, the EUR/USD intraday closes at 1.1990, forming a tiny real body.
This market situation represents why a shooting star candlestick has a small body.
Little to Now Lower Shadow
When the competition between buyers and sellers becomes stiff, a shooting star candlestick may form little to no lower shadow.
The little to no lower shadow of a shooting star candlestick results from the specific price action during the trading session. The price opens significantly higher, then reverses and closes near the opening price without falling much below it.
Confirm the Pattern
The high trading volume during the formation of the shooting star adds to its validity. It indicates significant market participation and enhances the reliability of the reversal signal.
Moreover, you should look for a confirmation candle that may form in the following period or candle.
A bearish candlestick following the shooting star, especially one that closes below the real body of the shooting star, strengthens the signal of a potential downtrend.
What Does a Green Shooting Star Candle Indicate?
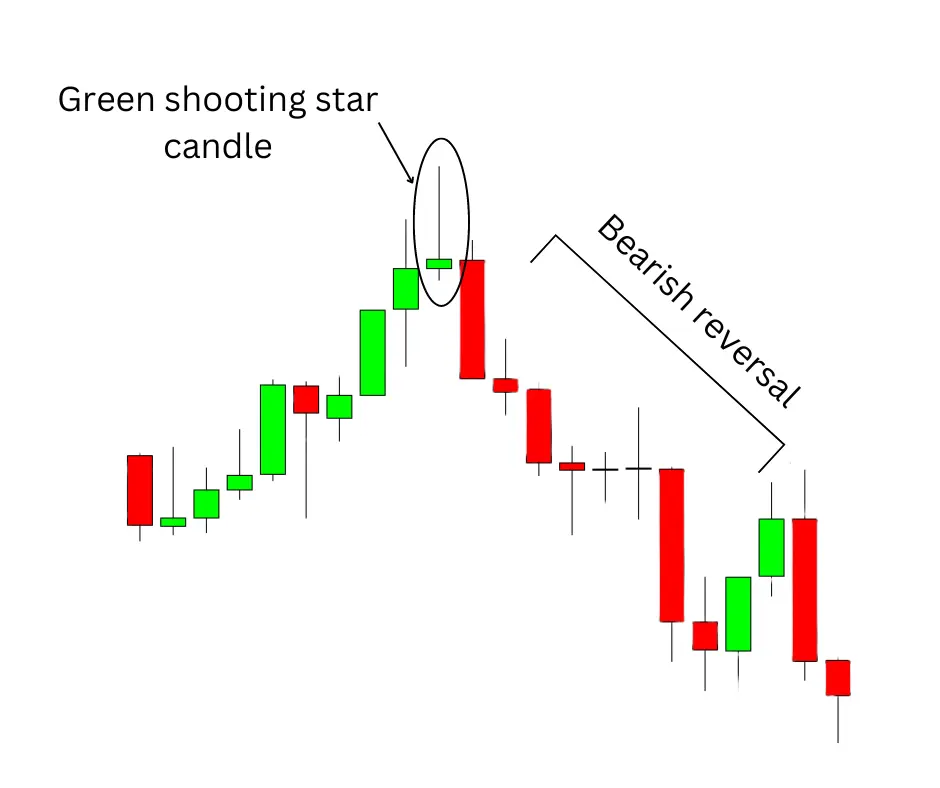
Often confused with the inverted hammer, a green or bullish shooting star is a visual representation of sellers’ unsuccessful attempts to push the price down. In other words, it signals that the bulls have yet to lose their strength in the specific period or candle.
While less common, the formation of a bullish shooting star indicates the potential of the market to reverse back to its prevailing uptrend after it declined.
Fast fact:
The only difference between the green and red shooting star candle is… well, the color!
Aside from the color, these shooting star candles share the same characteristics—long upper shadows, small bodies, and little to no lower shadows.
Advantages of Shooting Start Candlestick
Easy to spot
One of the well-loved characteristics of a shooting star candlestick pattern is its distinguishable look. Unlike other candlestick or price action patterns, the formation of this pattern is just so easy to spot.
Simply look for a sequence of green candles, spot a shooting star candle (long upper shadow, small body, and a little to no lower shadow), wait for the market to form the same candle for confirmation, and you’ll have an indicator that the market may reverse downward.
Strong bearish reversal signal once confirmed
When a chart shooting star appears after an uptrend, it signals that the buyers have pushed prices higher during the session, but sellers regained control by the end of the session, driving prices back down and subsequently forming a shooting star candle.
If confirmed by a subsequent bearish candle, it can indicate a strong reversal from a bullish to a bearish trend.
Limitations of Shooting Star Candlestick
Tendencies of false signals
A shooting star candlestick is not a magical nor a self-fulfilling indicator. One vulnerability it has is it can sometimes lead to false signals.
This false bearish reversal signal happens when a single shooting star appears, but the anticipated reversal trend doesn’t materialize.
To prevent this, always wait for a confirmation candle before trading the pattern. Also, use other trading indicators and analysis methods to ensure the safe positioning of trades.
Not a standalone indicator
If you plan to use this indicator to trade market reversal, you should know that using this is not enough. You should never use shooting star candlestick in isolation.
For a more reliable reversal spotting, you should also analyze the market through volume analysis, trendlines, support and resistance (S/R) levels, or other candlestick patterns.
Relying solely on the Shooting Star can lead to premature or incorrect trading decisions.
What Is the Difference Between Shooting Star Candle and Inverted Hammer?
The only difference between the shooting star candlestick and the inverted hammer candlestick lies in the context used.
If you look at the two candles, both look the same— long upper shadows, almost or no lower shadows, and small real bodies.
However, the two candles differ in terms of the market direction it trends after the candle formation.
The shooting star pattern shows at the peak of an uptrend, signaling a potential reversal from its prevailing uptrend. On the other hand, the inverted hammer forms at the bottom of a downtrend, suggesting a potential bullish reversal.
So, does this mean that shooting star and inverted hammer candles can act as the market’s support and resistance zones? Well, you can use both candles to predict the potential S/R zones, but not in isolation.
Identifying the S/R market zones requires a broader market analysis using other technical indicators and price actions.
Summing Up: Should You Trade Shooting Star Candlestick?
A shooting star candlestick pattern is an effective market pattern that indicates a potential market bearish reversal, especially when analyzed correctly. It’s crucial to remember that a single shooting star candle is not enough to act upon. You should always wait for a confirmation candle before you trade the pattern.
Ultimately, using this candlestick pattern in conjunction with other technical indicators and methods will surely increase the effectiveness of your trade.
Want to learn more trading strategies? Check out TradeGeek, explore courses, and start reading your way to master all aspects of forex trading.


