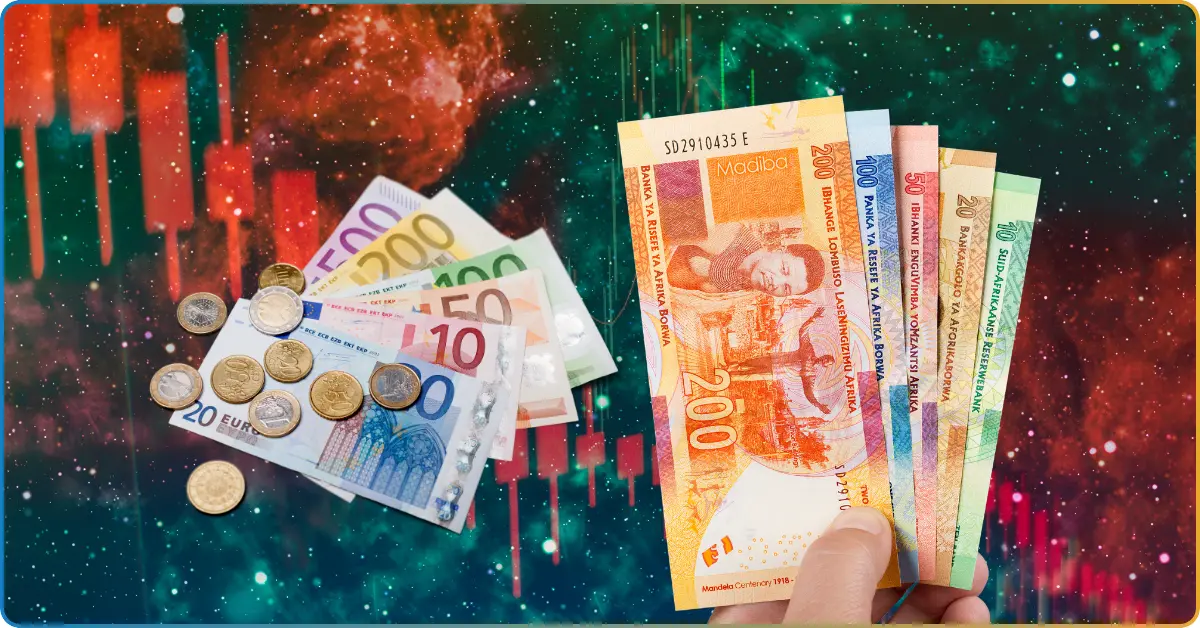
Over the past six months, the EUR/ZAR exchange rate has fluctuated, trading at a high of 20.46 ZAR and a low of 18.69 ZAR. In the upcoming year, the Euro to Rand forecast is a decreased Euro compared to the rand.
As of writing, 1 Euro is equivalent to 18.71 South African Rand.
This article discusses the currency pair euro to rand, how to read it in a price chart, the Euro to rand forecast, and the history of the currencies.
What is the EUR/ZAR Currency Pair?
The EUR/ZAR currency pair is a pair between the Euro and the South African Rand. It is considered an exotic currency pair because it trades a major currency (EUR) with a currency from an emerging economy (ZAR).
The EUR/ZAR experiences significant price swings and lower liquidity like other exotic currency pairs. However, the The EUR/ZAR currency pair is traded 24 hours a day, five days a week, except on holidays on the foreign exchange market. However, its most active trading time is during the overlap of the European and South African trading sessions.
This overlap occurs between 8:00 AM to 4:00 PM Central African Time (CET) and 9:00 AM to 5:00 PM South African Standard Time (SAST).
How do you read a EUR/ZAR price chart?
The price chart for a currency pair is what represents the exchange rate of the two currencies, in this case, the EUR/ZAR.
The EUR represents the base currency (the first currency in the pair), which is the currency you are buying or selling. Meanwhile, ZAR is the quote currency (the second currency in the pair), which shows how much of the quote currency is needed to purchase a unit of the base currency.
So, for example, if the exchange rate for EUR/ZAR is 18.71, this means that for every 18.71 rand, you can buy one Euro.
Euro to Rand Forecast 2024
Making informed forecasts for a currency pair’s movement involves a combination of analyses — fundamental, technical, and sentiment analysis.
Fundamental Indicators
Examining economic indicators and news events allows you to predict their impact on currency values. Common indicators include interest rates, inflation rates, and economic growth.
Take a look at the data below.
Fundamental Indicators for Eurozone and South Africa
| Eurozone | South Africa | |
| Interest Rates | The interest rate set by the European Central Bank (ECB) is currently 3.4% | The interest rate is 11.75% and is controlled by the South African Reserve Bank |
| Inflation Rates | The Eurozone inflation rate is 2.3% | Current inflation rate is 2.9% in South Africa |
| Economic Growth | The Eurozone’s GDP growth is projected to be 1.2% in 2025 | The growth rate is forecasted to be 1.5% in 2025 |
Meanwhile, historical, economic, and political relations between the two countries are also important for making better forecast decisions.
For instance, it’s important to note that the European Union (EU) is South Africa’s largest trade and investment partner. Agreements such as the Trade, Development, and Cooperation Agreement (TDCA) and the Economic Partnership Agreement (EPA) allow foreign direct investment (FDI) and development aid from the EU to South Africa.
In 2024 alone, South Africa exported a total value of R57.8 billion in agricultural exports to the EU.
On the other hand, the EU and SA have also formalized strategic political partnership. The two countries host regular summits and meetings to discuss issues of mutual interests, educational collaborations, and cultural exchanges.
If the two countries maintain a healthy political and economic relationship while properly managing their local economies, this could positively influence the exchange rates.
For instance, a strong trade balance can increase demand for currencies—if South Africa exports to the EU, buyers need to purchase ZAR to pay for goods.
Technical Indicators
Technical analysis involves analyzing historical price data and trading volumes to predict future movements. Common tools include charts and patterns, moving averages, and a relative strength index (RSI).
Sentiment Analysis
This gauges market participants’ overall mood and confidence in the EUR/ZAR. Tools used to analyze sentiment analysis include news and social media.
Note: This analysis provides a very broad framework for the Euro to Rand forecast and may not reflect live market conditions. Thorough research and analysis are highly recommended.
A Short History of the Euro
The Euro (abbreviated as EUR; symbol 💶) is the second-largest reserve currency and the official currency of 20 out of 27 states of the European Union.
The 20 participating states, which compromise the “eurozone,” include Austria, Belgium, Croatia, Cyprus, Estonia, Finland, Greece, Ireland, Italy, Latvia, Lithuania, Luxembourg, France, Germany, Malta, Netherlands, Portugal, Slovakia, Slovenia, and Spain. The Euro replaced the national currencies of these states in 1999.
ATMs could only dispense euros during the transition from national currencies to the Euro, but banks were allowed to exchange legacy currencies with the Euro.
The Euro was implemented by the European Union to facilitate cross-border trade and transactions within Europe. As a result, it has stabilized and developed Europe’s economy into one of the strongest in the world.
Because of the Euro’s strength, 22 countries outside the Eurozone have tied their currencies to the Euro to stabilize their local currencies’ value.
These territories include 14 countries in mainland Africa (CFA frank), three African island countries (Comorian franc, Cape Verdean escudo, and Sao Tome and Principe dobra), the French Pacific territories, two Balkan countries, and North Macedonia (Macedonian denar). Moreover, the Morrocan dirham is tied to a basket of currencies, with the Euro composing 60% of its weight.
In total, 209,545,000 people outside Europe use the Euro, benefiting from the Euro’s strength and stability.
A Brief History of the South African Rand
The South African rand has a rich history that accompanies the complex and diverse history of South Africa.
The South African Rand (abbreviated as ZAR; symbol R) is the national currency of South Africa and its 64 million population.
Before the rand, South Africa’s currency was heavily controlled and imposed by Dutch colonizers since the 1650s and then again by British invaders in 1795.
The first fiat currency in SA was the Dutch guilder, introduced by early Dutch traders in the 1600s. By the 1650s, the now-established Dutch settlements introduced their own monetary system to the Cape Colony. The currency used was the Dutch rijkdsdaalder, which was used for trade and economic activities in the area.
Afterward, the British established South Africa as a colony in 1795 until the 19th century. At this time, South Africa’s currency was the pound and shilling.
The rand was introduced and replaced the pound on February 14, 1961, a day before the Republic of South Africa was established. At the time, the rate was 2 rand to 1 pound.
The currency’s name comes from Witwatersrand, the ridge on which Johannesburg was built and where most of South Africa’s gold reserves are located.
Take your trading knowledge to the next step
Keep pace with trading news, industry insights, and market analysis on CommuniTrade. Pose questions, validate information, and join conversations that matter.
Get started here.


