Japanese candlestick patterns are arguably the most beginner-friendly charting indicator out there. They’re easy to spot and helpful in smoothening the prevailing price action for a more informed market analysis.
But here’s the thing: this popularity entails the rise of different candlestick patterns. With hundreds of available candlestick patterns, beginner traders are left even more confused about what to use.
And our trading experts did all the legwork for you! They backtested and traded over 30 candlestick patterns to assess the reliability and profitability of each pattern. In this TRU Insight, we’ll introduce the 5 best candlestick patterns that beginners should use to make an informed trading decision.
What Is a Candlestick Pattern?
Let’s have a quick review of candlesticks first.
At its core, a candlestick chart displays the opening, high, low, and closing prices of an asset in a particular timeframe. Among other types of trading charts, the candlestick chart is the most informative as it shows the four key prices of an asset.
In candlestick trading, there are four factors that you should look at:
| Body | Represents the range between the opening and closing price. |
| Lower Shadow/Wick | Indicates the lowest price that the asset traded. |
| Upper Shadow/Wick | Represents the highest price that the asset traded, |
| Body Color | Signifies the market trend. A red candle represents a bearish trend, while a green candle signifies a bullish candle. |
Now, a candlestick pattern is technically a shape that forms a candlestick chart. These patterns are specific formations created by one to three candlesticks on a chart. By visually representing the prevailing price action and market sentiment, candlestick patterns are known to provide easy-to-understand insights into future price movement.
Want to explore more trading indicators that actually work? CommuniTrade connects you to thousands of online traders worldwide, enabling you to master the market with their first-hand experiences and practical insights.
5 Best Forex Candlestick Patterns for Beginners
After spending hundreds of hours in intensive backtesting and live trading using over 30 candlestick patterns, our TRU experts picked 5 best candlestick patterns by looking at their beginner-friendliness and success rate.
Shooting Star Candlestick

The shooting star candlestick pattern is arguably one of the most used indicators to identify potential bearish reversal. As a bearish reversal pattern, a shooting star forms at the peak of an uptrend and ultimately reverses to indicate the shift in market sentiment.
This pattern comprises three candles: a bullish candle, a small bearish candle with a long upper shadow, and a long bearish candle.
| Candle Order | Candle Type | Market Implication |
|---|---|---|
| First Candle | Long bullish candle. | Represents the last push of the buyers to further rally the price. |
| Second Candle | Short bearish candle with extended upper shadow (wick). | Signifies the intervention of the sellers, causing a shift in market sentiment. |
| Third Candle | Bearish candle with a length comparable to the first candle. | Indicates the trend reversal from bullish to bearish. |
The moment an uptrend is nearing its end, and its momentum is about to exhaust, the market tends to form a shooting star pattern—a bearish candle with a long upper shadow and almost the same open, low, and closing prices.
Read More: Guide to Shooting Star Candlestick + Exclusive Tips in 2025 – TradersUnited
Doji Candlestick

The Doji candlestick pattern appears when the open and close prices are the same, or very close to each other, during a given trading period.
The Doji represents uncertainty in the market. Uncertainty usually occurs in the forex market when a currency’s country experiences significant economic or political changes, such as an interest rate announcement, a new president, or a conflict.
Read More: Guide to Doji Candlestick Pattern + Exclusive Tips in 2025 – TradersUnited
Plus Sign Doji
Also known as the standard Doji, a plus sign Doji indicates the balance between buyers and sellers, but neither has a clear advantage.
This type of Doji has a small body with long shadows (wicks) above and below. Visually, the standard Doji looks like a cross or a plus sign, which indicates that the price moved significantly during the session but closed near the opening price.
On its own, a standard Doji is considered a neutral pattern. However, its significance can increase when it appears after a strong price movement, potentially indicating a trend reversal.
Cross Sign Doji
The cross-sign (also called “dragonfly” or “long-legged”) is a more extreme version of the standard Doji. It has a small or almost nonexistent body with longer shadows on both ends.
This pattern reflects a strong battle between buyers and sellers, but there is no clear winner by the end of the trading period. Ultimately, this indicates heightened indecision or extreme market volatility during this period.
This pattern is most significant when it appears after a strong uptrend or downtrend, as it suggests an imminent market reversal as the current trend is losing momentum.
Inverse Cross Sign Doji
Also called the Gravestone candle, the inverse cross sign Doji has a long upper shadow and a small body at the bottom of the candle.
This pattern indicates that buyers tried to push the prices higher but could not sustain the momentum due to the prevailing selling pressure. Thus, this pattern formation signals a potential bearish reversal.
Three Black Crows Candlestick
The Three Black Crows pattern signals a potential bearish reversal after an extended uptrend. Its name comes from an old Japanese saying, “Bad news has wings.”
To identify a three-black crow pattern, the candlesticks should open on the real body of the candle before it. The lower a succeeding candlestick opens at the real body of the candle before it, the stronger the signal is.
Moreover, three black crows tend to open with a price higher than the previous close, but the price is pushed to a new level low by the third candle. You can then confirm the downtrend once the market forms the third candle.
Read More: Guide to Three Black Crows Candlestick Pattern + Exclusive Tips to Trade it in 2025 – TradersUnited
Morning Star Candlestick
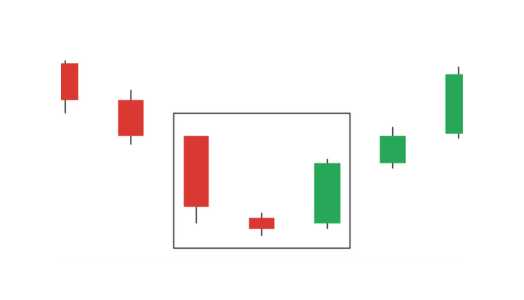
The morning star candlestick pattern is a three-candle pattern that signals a bullish reversal.
By nature, this Japanese candlestick pattern should be established at the bottom of a downtrend and then form these three candles: a large bearish candle, a Doji, and a bullish confirmation candle:
| Candle Order | Candle Type | Market Implication |
|---|---|---|
| First Candle | Large bearish candle | Indicates the current selling pressure |
| Second Candle | Small real body | Indicates market indecision upon the buyers’ intervention |
| Third Candle | Large bullish candle | Confirms the uptrend reversal |
Hammer Candlestick

A hammer candlestick resembles a literal hammer. It has a small real body (the head) and a long lower shadow (the handle) that extends significantly longer than the rest of the candle.
A price chart with a hammer pattern indicates a potential bullish market reversal. This candle often forms in a declining market or when the market is about to find its bottom after a series of red candles.
Read More: Guide to Hammer Candlestick Pattern + Exclusive Trading Tips in 2025 – TradersUnited
Three Types of Candlestick Patterns
Candlestick patterns are categorized into three groups: Singles, Duals, and Triples. Basically, this categorization represents how many significant candles there should be to confirm the signal.
Single Candlestick Pattern
As the name suggests, single candlesticks only require one significant candle to signal a potential market reversal.
These patterns are common in the market. However, trading these requires a thorough multi-indicator analysis to ensure the accuracy of the signal.
Dual Candlestick Pattern
Also known as the double candlestick pattern, the dual candlestick pattern requires two candles to confirm the signal.
Basically, there should be two significant candles to form within the pattern to predict the future price movement.
Among the dual candlestick pattern types are the bullish engulfing, bearish engulfing, tweezer tops, and tweezer bottoms patterns.
Triple Candlestick Pattern
As its name suggests, a triple candlestick pattern comprises three candles. Spotting a triple candlestick pattern is considered rare because of the complex pattern formation.
How complex?
It has to form three candles with specific colors, wick extension, and body length – subsequently.
The first candle represents the preceding trend, the second signifies the trend reversal or continuation, and the third confirms the signal.
Frequently Asked Questions
Are Candlestick Patterns Reliable?
While valuable, candlestick patterns are dispensable by themselves. Their over-reliance on the prevailing price action makes them sensitive to market noises, ultimately making them susceptible to providing false signals.
Always confirm the candlestick signal by utilizing multi-indicator analysis.
Is Candlestick Pattern Free?
Yes, candlestick patterns are patterns and not tools, so you don’t have to pay a fee to spot them. Additionally, learning about candlestick patterns can be free. There are many resources available online, including free PDF guides and articles that explain various candlestick patterns and how to use them in trading.
Read More: 10 Candlestick Patterns Every Trader Should Know + Free PDF – TradersUnited
What Are Bullish and Bearish Candlestick Patterns?
Bullish candlestick patterns indicate potential upward price movements and often form after a downtrend. On the other hand, candlestick patterns suggest potential downward price movements and often form after an uptrend.
Should You Rely on Candlestick Patterns in 2025?
While candlestick patterns are a powerful tool to gauge the prevailing price action and predict future price movement, they should be used in conjunction with other analysis methods and market insights to maximize their effectiveness.
Joining a trading community could also help you make better-informed trading decisions as you tap into the collective and practical knowledge of experienced traders.