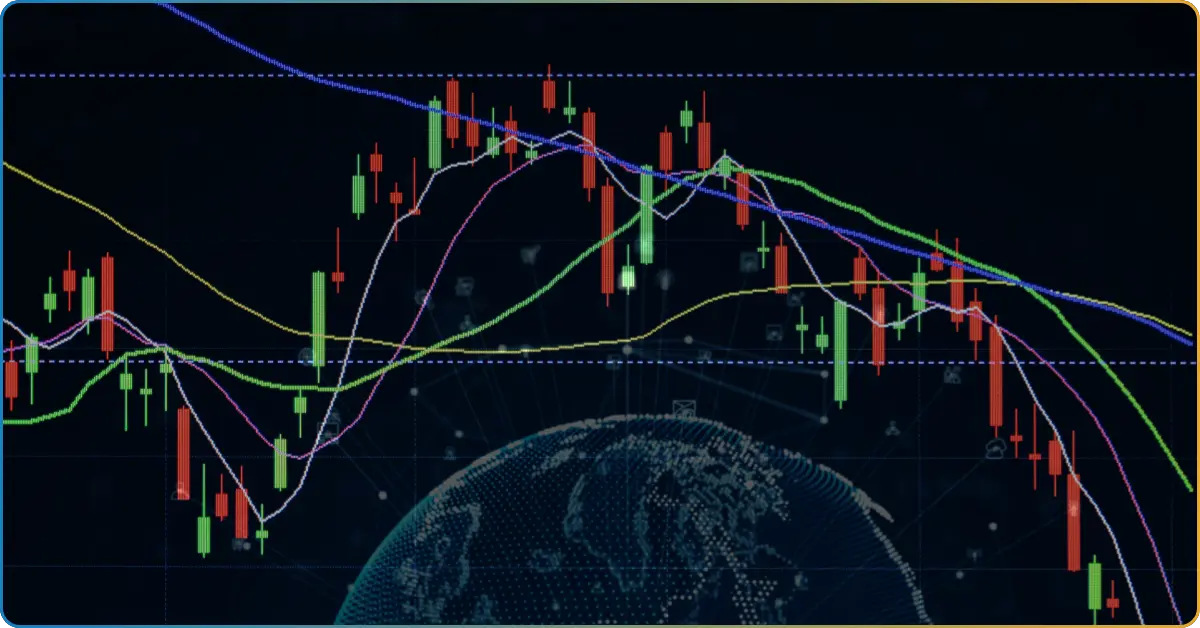
The Japanese candlestick pattern is probably one of the most used trading indicators for forex.
It’s cost-effective as charting patterns are generally free—you only monitor the chart for any possible pattern that the price action makes. Ultimately, it offers a great perspective as to how the market is moving based on the attitude of buyers and sellers.
While these patterns are generally considered easy to spot, they are not created equal. In this TRU Insight, we’ll explore the 10 beginner-friendly candlestick patterns you can use to kickstart your trading journey.
What Is a Candlestick Pattern and How Does It Help You Trade Forex?
If you’ve been online trading, you know that the financial markets are nothing without their dynamic and complex nature. It’s the truth that deters interested investors from participating in the market.
However, all is not lost. Candlestick patterns provide clarity in complex, noisy financial markets. Candlestick patterns (also known as Japanese Candlestick patterns) visually represent the price action of an asset, highlighting any possible trend.
This pattern comprises candlesticks—a charting tool that resembles a candle with a real body, lower wick (shadow), and upper wick (shadow). All these candlestick parts represent a vital periodic price point, notably the asset OHLC (opening, high, low, close).
- The real body shows the range between the opening and closing price of the asset.
- An upper wick (shadow) represents the highest price or peak of the asset traded during the period.
- A lower wick (shadow) represents the lowest asset price traded during the period.
Japanese candlestick patterns are considered the most beginner-friendly trading indicator by providing a visual insight into the prevailing price actions. However, no one should treat the Japanese candlestick as the ultimate indicator. The complex financial markets require a more comprehensive analysis to identify their prevailing trend.
Three Types of Market Trends
Profiting from online trading requires an understanding of these three types of market trends. Only when you distinguish these trends from one another can you exploit and ultimately cash in on your trades.
Here are the three types of market trends and what they tell you about the future market price movements.
| Type of Trend | Market Implication |
|---|---|
| Reversal | The market will reverse its primary trend (bullish to bearish or vice versa). |
| Continuation | The market will consolidate for a short period and continue its primary trend after the consolidation period. |
| Bilateral | The market will move in either direction (bullish or bearish) due to the lack of market clarity. |
Note: Due to a lack of clarity, bilateral is by far the most tricky trend to trade.
Get Your Free Copy of the Chart Pattern PDF
Download the chart pattern eBook now and master 40+ chart patterns in 40-minute reading time. Spot chart pattern for profits like a pro with our chart pattern eBook!
How to access?
- Log in to your TRU account. Don’t have an account? Create one for FREE!
- Access the Trading Resources space
- Locate the “The Trader’s Blueprint: Mastering Chart Patterns E-book” post
- Download the E-book for free
10 Beginner-Friendly Candlestick Patterns
Generally, Japanese candlestick patterns are considered one of the most beginner-friendly trading indicators. These patterns offer traders crucial and actionable insights into the potential trend while remaining easy to spot and interpret.
Let’s explore the 10 powerful candlestick patterns that every beginner trader should know.
Doji
| Candlestick Type | Signal |
|---|---|
| Single Candlestick | Bilateral Trend |
A Doji candlestick is one of the most spotted patterns due to its simple appearance. It’s a candlestick with a really small body, making it distinctive among other candles in the chart.
The market forms this pattern when the asset’s opening and closing prices level with each other. Oftentimes, it creates a small body with an almost 10-pip range. But most of the time, it almost doesn’t create a body, leaving a candle with a vertical line as a real body.
There are four primary types of Doji candles:
- Long-legged Doji: This candlestick has extended upper and lower wicks, with a real body being at the center.
- Dragonfly Doji: This candlestick has an extended lower wick and little to no upper wick.
- Gravestone Doji: This candlestick has an extended upper wick and little to no lower wick.
- 4-Price Doji: This is a four-candle pattern that represents a stretched market indecision. The market indecision or equilibrium drives this pattern formation.
Generally, doji candlestick patterns signal a bilateral trend due to the lack of buying or selling pressure that pushes the market into a particular direction.
Shooting Star
| Candlestick Type | Signal |
|---|---|
| Single Candlestick | Reversal Trend |
A shooting star candlestick is found at the peak of a bullish market. It forms as the buying pressure exhaust, causing the sellers to take over and drag the price down. Imagine the price action as the shooting star dipping from the galaxy.
But how do you spot a shooting star? Well, you’ve got to know what it looks like first.
A shooting star candle has a long upper shadow, a small real body, and a little lower shadow. The upper shadow ultimately signifies the exhausting effort of buyers to rally the price.
When the market forms this chart pattern, it signals a potential bearish reversal.
Inverted Hammer
| Candlestick Type | Signal |
|---|---|
| Single Candlestick | Reversal Trend |
An inverted hammer forms at the bottom of an extended downtrend.
When the market forms this pattern, it generally indicates a possibility for a bearish reversal trend. This happens as the bears (sellers) fail to further drag the price down due to the buying pressure brought by the bulls (buyers).
Similar to the shooting star candlestick, an inverted hammer candle comprises a long upper shadow, little to no lower shadow, and a small real body. How do the two candlesticks differ? Their differences lie in the preceding trend in which the candle occurs.
Inverted hammer candle occurs at the bottom of a downtrend, opposite to the shooting star hammers that form at the peak of an uptrend.
Bullish Engulfing Pattern
| Candlestick Type | Signal |
|---|---|
| Dual Candlestick | Reversal Trend |
A bullish engulfing pattern is part of an engulfing pattern group—a dual candlestick pattern that forms a relatively larger candle that eats or engulfs the previous candle.
In this pattern formation, the two candles form at the bottom of an extended downtrend. The first (smaller) bearish candle indicates that the selling pressure from the bears is about to exhaust. Meanwhile, the second (larger) candle is bullish, confirming the change in market sentiment.
Both engulfing candlestick patterns suggest trend reversal, as the second candle (the engulfing one) represents the sudden yet significant change in market sentiment.
Bearish Engulfing Pattern
| Candlestick Type | Signal |
|---|---|
| Dual Candlestick | Reversal Trend |
As it suggests, the bearish engulfing pattern is the counterpart of the bullish one. It forms at the peak of an uptrend, ultimately signalling a potential downward reversal.
When the market forms this pattern, it suggests that the rallying price is about to exhaust its buying power due to the intervention of the bears (sellers). The price forms a small bearish candle, serving as its last effort to rally. However, the formation of a relatively larger bearish candle marks the entry of selling pressure, significantly shifting the prevailing market sentiment.
Tweezer Top Pattern
| Candlestick Type | Signal |
|---|---|
| Dual Candlestick | Reversal Trend |
The tweezer top pattern is another dual-candle pattern that indicates a potential reversal trend. This candlestick pattern occurs at the peak of an uptrend and forms two candles:
- First candle: The bullish candle at the end of an uptrend represents the final push of the buyers. This candle indicates that the market is still under buying pressure.
- Second candle: The second candle represents a shift from an uptrend to a downtrend, indicating that the bears have taken over the price action.
When you trade this pattern, you essentially wait for a confirmation candle that will form after the second candle. This ensures that your tweezer top trade won’t be subjected to a false signal.
Tweezer Bottom Pattern
| Candlestick Type | Signal |
|---|---|
| Dual Candlestick | Reversal Trend |
The tweezer bottom pattern is the counterpart of the tweezer top—it forms at the bottom of an extended downtrend, ultimately suggesting that the bearish market is about to run its course. In other words, this pattern signals a bullish reversal trend.
Just like the tweezer top, this pattern requires two candles to form. The first candle should always be bearish to signify the last push of the sellers to push the price down. However, it should be followed by a bullish candle to represent the sudden shift of market sentiment.
When trying to spot a tweezer candlestick pattern (either tweezer top or bottom), remember that both candles should be at a similar level or at least close to one another.
Evening Star
| Pattern Type | Signal |
|---|---|
| Triple Candlestick | Reversal Trend |
The evening star candlestick is a triple candlestick pattern, meaning the market must form three consecutive candles aligned with the determined rules. With its complex formation, triple candlestick patterns like the evening star are considered rarer than the other patterns.
Going back, an evening star pattern informs you about the potential bearish trend reversal. It forms these three candles:
- First candle: A long bullish candle representing the last push of the bulls to rally the price.
- Second candle: A small candle, resembling a star, to indicate the shifting market sentiment.
- Third candle: A decisive bearish candle, representing the confirmation of the bearish reversal trend.
Morning Star
| Pattern Type | Signal |
|---|---|
| Triple Candlestick | Reversal Trend |
The formation of a morning star candlestick is a three-candle pattern that forms at the bottom of an extended downtrend.
When the bearish market established this pattern, it indicated that its selling pressure was running its course and that the bulls were taking over the market.
Ultimately, it signals that the price will reverse to bullish.
Here are the three candles that you must spot to confirm the pattern formation:
- First candle: Long and bearish (red)
- Second candle: Small with extended lower shadow
- Third candle: Longer than the first and bullish
Remember, the second candle can be red or green. However, a green candle provides a more solid bullish signal than the other.
Rising Three
| Pattern Type | Signal |
|---|---|
| Triple Candlestick | Continuation Trend |
A rising three-candlestick pattern forms at the peak of a defined uptrend. It creates three candles with lower highs and lower lows.
The formation of the three candles that rise indicates that the sellers are trying to change the bullish movement of the price.
However, the market will create a decisive or confirmation candle after the rising three. This candle shows that the buyers have reclaimed their control over the market and will push the price higher.
This pattern has a counterpart in the chart, namely the falling three patterns. A falling three candlestick pattern is found at the bottom of the downtrend, which continues to trade lower once the consolidation concludes.
Should You Rely on Candlestick Patterns?
“The financial markets are complex and dynamic as they move on myriads of factors.”
That’s a tale as old as time. Despite online trading being lucrative, only a few succeeded in maximizing its profitable potential. This is because they treat any trading indicator as the ultimate indicator.
Japanese candlesticks, just like any trading indicator, may provide signals that may do your investment more harm than good. To ensure you’re looking at a bigger perspective when you’re trading, you must use multiple indicators to make sense of the prevailing price action and market trend.
Joining a trading community could also help you make better-informed trading decisions as you tap into the collective and practical knowledge of experienced traders.

