Super quick history lesson!
Did you know Japanese candlesticks can be traced back to the 17th century? It was used by rice traders to track market prices and predict its future movement.
However, it was only introduced to the West in the 1990s through Steve Nison’s book titled “Japanese Candlestick Charting Technique.”
Since then, this charting technique has become a staple in the strategies of online traders.
In this lesson, you’ll explore the three main parts of Japanese candlesticks and learn how to interpret them to make a profitable trading decision.
Overview: What Are Japanese Candlesticks?
Japanese candlesticks trading is the most popular way to trade the forex chart. The reason behind its popularity is the intuitiveness it offers.
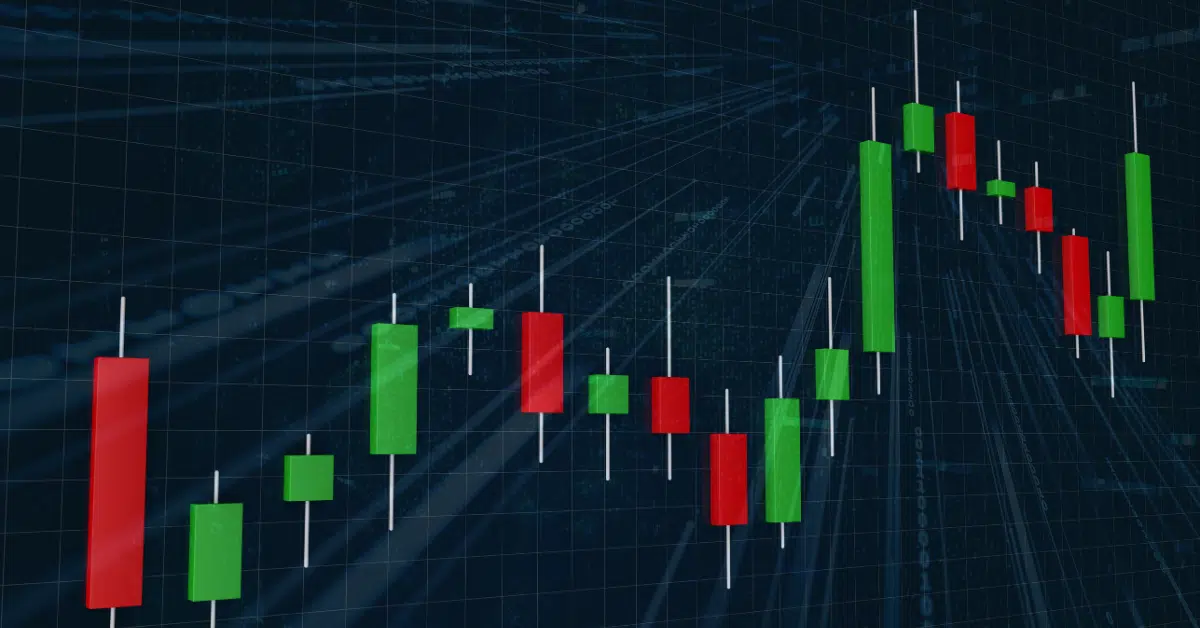
Unlike the traditional line or mountain chart, Japanese candlesticks provide more information about the price action that’s easy to interpret. This includes the market’s OHLC—the opening price, highest point, lowest point, and closing point.
Each part of the candlestick gives you a reference to the market’s HLOC. Here are the three main parts of Japanese candlesticks:
Upper Wick
Also known as the upper shadow, the upper wick represents the highest price that the market traded during the period.
The formation of the upper wick signifies that the asset trades higher than its opening price.
Real Body
The candle’s real body represents the range between the asset’s closing and opening prices.
The color of the real body can either be green or red – depending on the movement of the asset.
Say the EUR/USD opens at 1.2000 and closes at 1.2300 – the color of the body will be green to indicate an uptrend during the period.
If the price opens at 1.2300 and declines to 1.1900 at closing, the period will form a red body indicating a bearish market period.
The length of the real body depends on the stretch of the asset’s opening and closing price. The wider the spread between the open and closing price, the longer the candle will be. If the asset opens and closes at the near levels, it forms a little to no real body.
Lower Wick
Also known as the lower shadow, the lower wick represents the lowest price the asset reached during this period. This is the counterpart of the upper wick.
The lower wick forms at the bottom of the real body and extends lower.
Red vs. Green Candlestick – the color matters!
The color of the candlestick reveals the battle between the bulls and the bears.
The price will form a green candle if the bulls take over the market. This candle color represents an uptrend because the price closes at a higher level than its opening.
Conversely, a red candle suggests otherwise – it’s the seller dragging the price down due to immense selling pressure. When this happens, the price will close at a lower level than its opening.
Note: In some charts, Japanese candlesticks are represented by a set of black-and-white candles. A black candle is bearish (red candle), and a white is bullish (green candle).
Top 3 Japanese Candlestick Patterns
There are more than 10 candlestick patterns out there. However, you don’t really have to familiarize yourself with all of them—that would be a waste of effort and brainpower.
Here are the three primary types of candlestick patterns and what they tell you about the market.
Shooting Star Candlestick – Bullish to Bearish Trend
The shooting star signals the potential for the bullish market to have a declining price – just like the shooting star that falls from the sky.
This market pattern has three Must-Spot elements to ensure the accuracy of the pattern:
- An extended upper shadow
- A really small real body – can be green or red
- Little-to-no lower shadow
Again, this pattern formation suggests that a bullish market will run its course and will push the price down. But what really happens to the market during this formation?
Look at the three candles that form during this formation:
- Long bullish candle- This candle represents the bulls’ ongoing buying momentum.
- A shooting star candle- The formation of this candle indicates the intervention of the bears to the market and the exhausting bullish trend.
- Longer, bearish candle- The occurrence of this candle ultimately confirms the bearish reversal. This candle extends longer than the first candle.
Hammer Candlestick – Bearish to Bullish Trend
The hammer candlestick signals a bullish reversal market.
This hammer-shaped candle should have a little to no upper shadow, a real small body, and an extended lower shadow. Additionally, this hammer candle should appear at the bottom of the bearish market and must be followed by a bullish candle.
The formation of this candlestick pattern suggests that the prevailing selling pressure (represented by the first candle) is about to end (represented by the hammer candle) and the market will become bullish (represented by the third candle).
Doji Candlestick – Market Indecision
A doji candlestick pattern appears rarely in the market. Unlike the two patterns mentioned above, the formation of a Doji pattern signals little to no information about the trend reversal.
Why?
Because neither the bulls nor the bears push the price in their preferred direction. When that buyer-seller tug-of-war happens, the market will have roughly equal higher and lower shadows and a small real body.
Additionally, a doji candle is a single-candle pattern that resembles a cross, an inverted cross, or a plus sign.
During this pattern formation, the market enters its consolidation phase. This happens when the prevailing price pauses because of market indecision—neither the bulls nor the bears push the market enough to make a significant movement.


